What are sorted pictograms?
Sorted pictograms are icons that convey proportions and probabilities in a way that is easy to understand. For example, a pictogram that shows that eight out of ten dentists endorse a toothpaste would be considered a sorted pictogram.
How do sorted pictograms induce optimism?
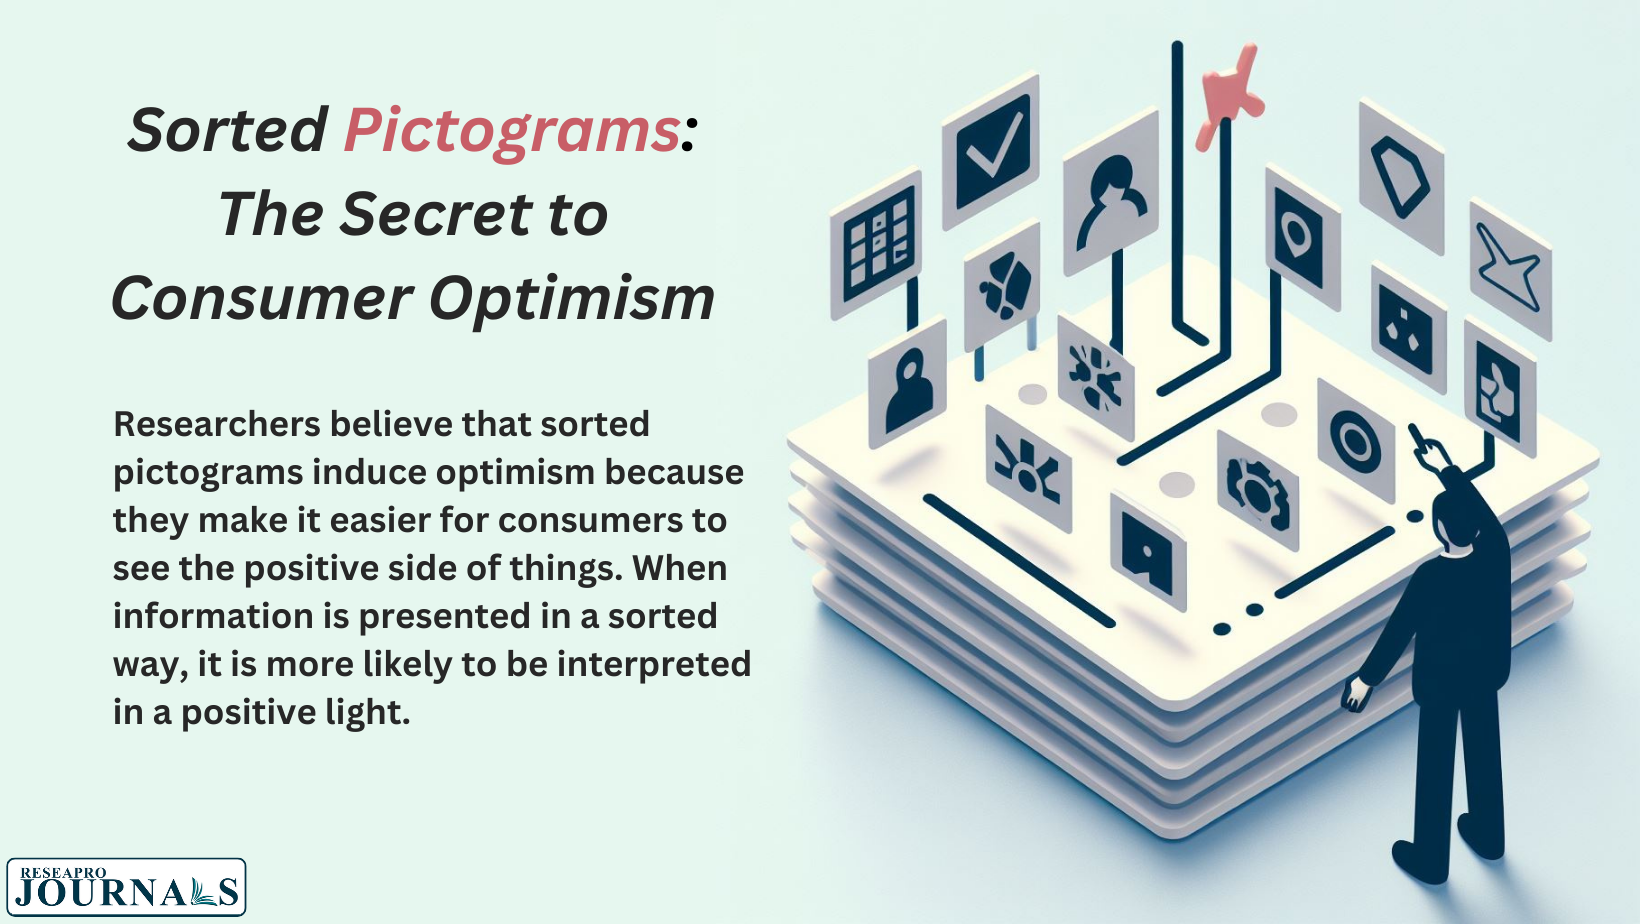
Researchers believe that sorted pictograms induce optimism because they make it easier for consumers to see the positive side of things. When information is presented in a sorted way, it is more likely to be interpreted in a positive light.
What are the implications of this research?
The findings of this research have important implications for marketing and public policy. For example, companies can use sorted pictograms to make their products more appealing to consumers. And governments can use sorted pictograms to communicate important information to the public in a way that is more likely to be heeded.
What are some examples of how sorted pictograms can be used?
Sorted pictograms can be used in a variety of ways, including:
- Marketing: Companies can use sorted pictograms to promote their products and services. For example, a company could use a sorted pictogram to show that its product is endorsed by a majority of consumers.
- Public policy: Governments can use sorted pictograms to communicate important information to the public. For example, a government could use a sorted pictogram to show that the risk of a certain disease is low.
- Education: Educators can use sorted pictograms to help students learn new information. For example, a teacher could use a sorted pictogram to show the different steps involved in completing a task.
What are some of the limitations of this research?
This research is limited in a few ways. First, it only focused on the effects of sorted pictograms on consumers’ perceptions of products and services. It is possible that sorted pictograms have other effects, such as influencing consumers’ decision-making or their behavior. Second, the research only focused on one type of pictogram. It is possible that other types of pictograms have different effects on consumers.
What are some future directions for this research?
Future research could explore the following questions:
- How does the number of categories represented in a pictogram affect consumers’ perceptions?
- What role does the number of icons, their size, or using multiple colors within one icon to show fractional proportions play?
- How do sorted pictograms affect consumers’ decision-making and behavior?
- How do sorted pictograms affect consumers’ perceptions of different types of information, such as risk information or benefit information?
The research on sorted pictograms is still in its early stages, but it has the potential to have a significant impact on the way we communicate information. By understanding how sorted pictograms can induce optimism in consumers, we can use them to promote positive messages and make the world a more hopeful place.


