During the recent past, scientific publications have undergone radical transformation. Rather than relying upon static figures, authors are increasingly using interactive figures to present the data and articulate their thoughts. There is a growth in the usage of interactive figures and multimedia in scientific publications.
What are Interactive Figures?
Interactive figures are HTML based figures that allow visual representation of the data in such a way that users feel better engaged with the content. These have emerged as an effective tool of data communication. Interactive media permits the users features like rotate, zoom in and zoom out the data, and analyze it with different perspectives. Contrary to the conventional static figures, here the users can manipulate the variables and comprehend the data holistically.
Why There is a Growing Trend of Interactive Figures in Scientific Publications?
Scientific authors are greatly relying upon interactive figures for the following reasons:
- Enhance Data Presentation: Interactive figures empower the authors to literally play with the data. The authors can now dynamically present the data and its findings.
- Improves Visualization: Interactive figures enhance the visualization of the data by manipulating with the colors, shapes, and sizes etc. hence generates an interest among the users to delve into the entire paper.
- Facilitate Comprehension: Interactive figures offer better data-driven insights. The users can easily comprehend the data and reach holistic conclusions.
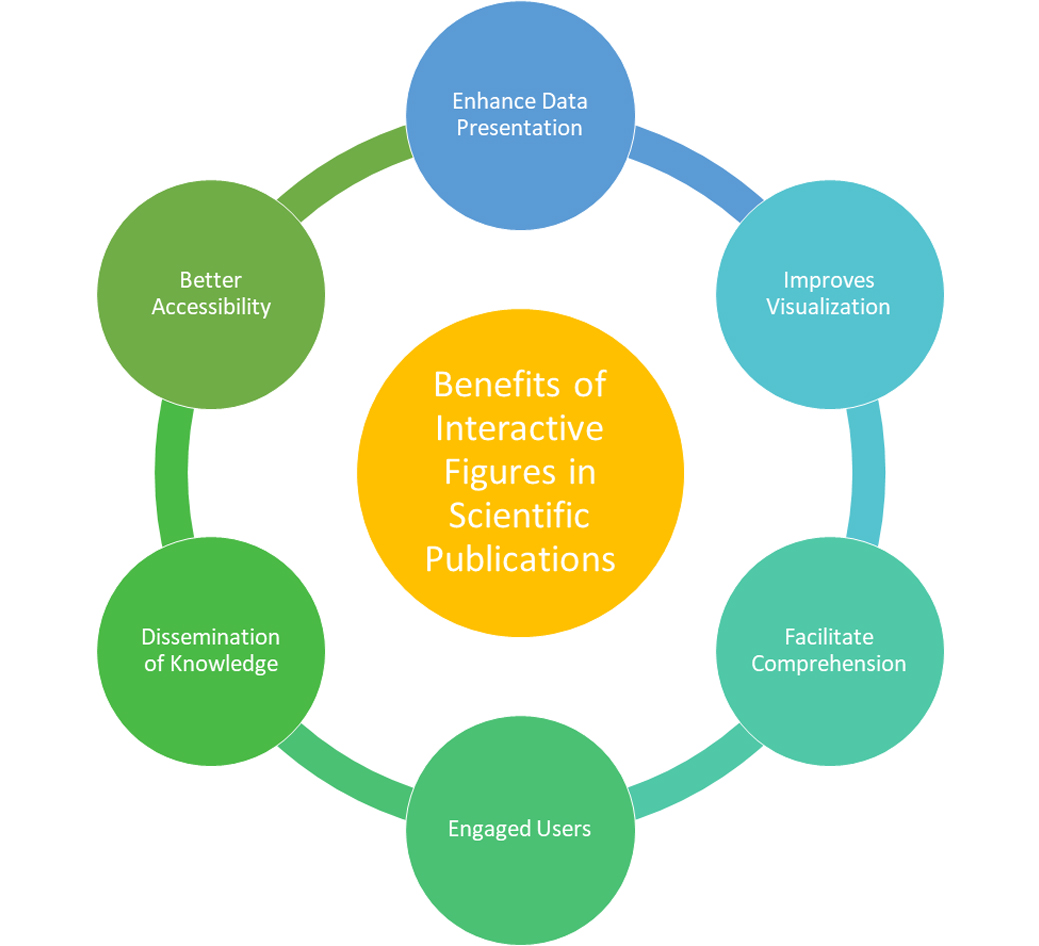
- Engaged Users: Interactive figures better engage the users with the data and offer a more enriching reading experience. Rather than being passive readers, they actively engage themselves with the data.
- Dissemination of Knowledge: Interactive figures allow the users to manipulate the data hence improves the dissemination of scientific knowledge amid diverse audiences. Not only the width but the quality of knowledge dissemination also improves with interactive media.
- Better Accessibility: Interactive figures facilitate easier comprehension of scientific data hence improves the accessibility of data findings among the common masses or those who are naïve in their domain.
What are the Challenges involved in including Interactive Media in Scientific Publications?
While we have already listed the multiple benefits, it is also important to understand the challenges involved in including interactive figures in scientific publications.
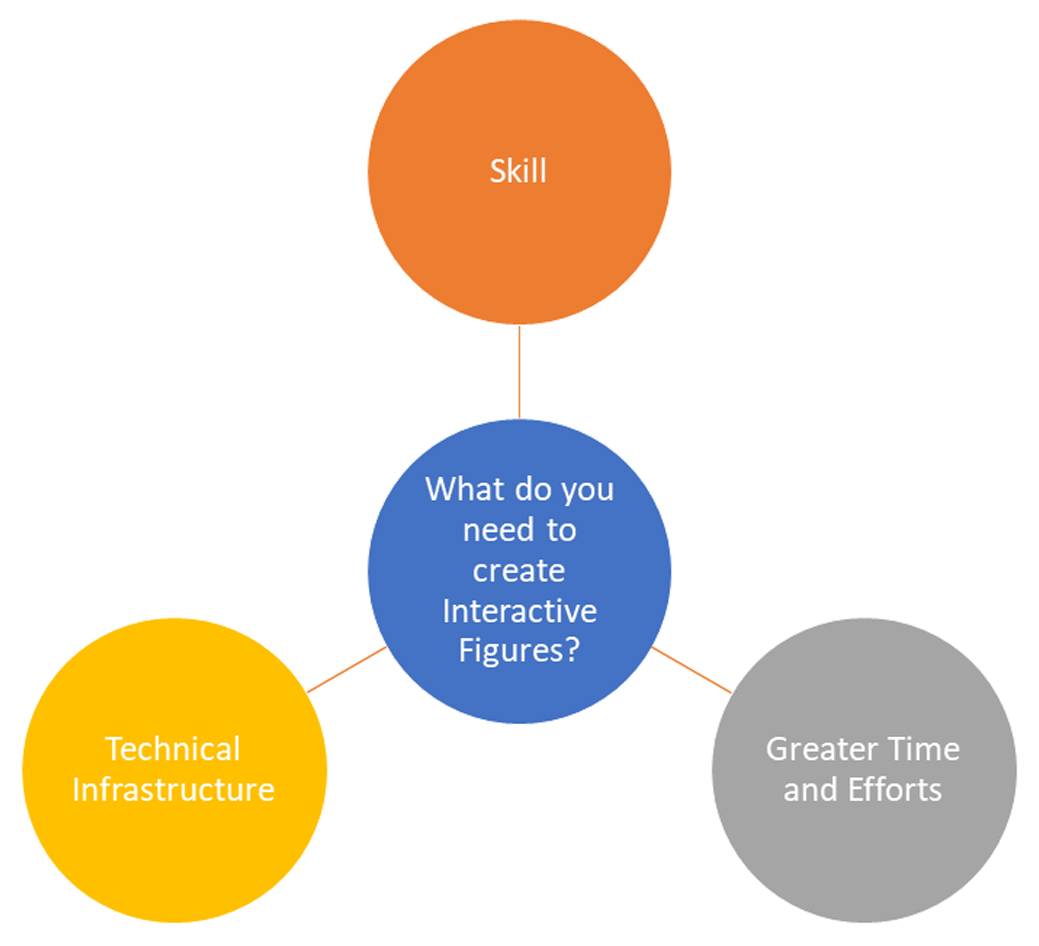
- Skill-based: While it is not rocket science, creating interactive figures demand skill. One must acquire the skill to aptly design interactive figures.
- Higher Costs: Higher costs are often associated with interactive media as compared to the traditional static one in the form of more time, and greater efforts.
- Technical Infrastructure: The author as well as the user, both require technical infrastructure to deal with interactive media.
Conclusion
Interactive media has enhanced the charm of scientific publications by empowering the authors and the users to dynamically engage with the data. But it requires expertise and cautious endeavors to capitalize upon the benefits of interactive media.